Line Analyst
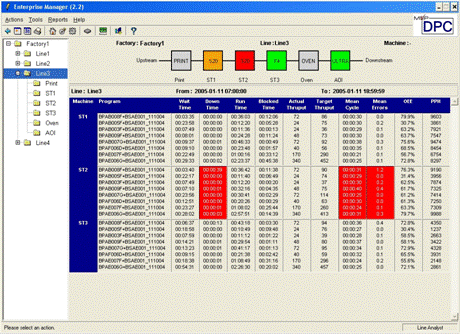
The diagram at the top of the window shows the current state (running, waiting, blocked or down) of each machine on the line using coloured blocks.
The tabular information shows, for each product run, the cumulative state times, throughputs, errors and efficiency of each station. Areas of particular interest (i.e. the machine with the slowest cycle time, largest non-productive time or highest number of errors) are highlighted in red to focus attention on the worst performing machine.


