Machine Analyst
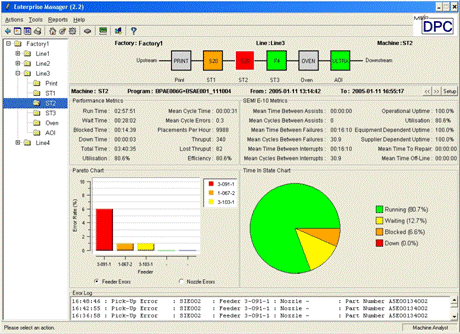
Gives detailed information on the performance of individual machines. As well as the cumulative state durations, throughput and cycle time, figures for SEMI-E10 metrics such as Mean Time Between Assists and Operational Uptime are also shown.
Pareto charts showing the top five worst performing feeders and nozzles can be further explored from the bar chart.
If Process Control Manager is active, the Time-in-State pie chart can be drilled to give a detailed pareto of reasons and remedies for each non-productive time element.
 |
|


