


Trend Analyst
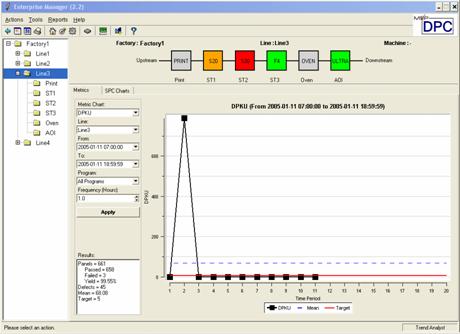
Trend Analyst enables the user to plot real-time and historical metric charts and SPC (Statistical Process Control) charts to identify process trends and out of control conditions based on inspection results from AOI. Trend Analyst provides a tabset - with one tab for "Metrics" and one tab for "SPC Charts".
The currently available metrics are DPKU (Defects Per Thousand Units), PPM (Defective Parts Per Million) and Yield. If a new data point does not meet the relevant target value, a process control alarm will appear which must be cleared.
The currently available SPC charts are Number of Defects (c chart), Defects Per Unit (u chart), Number Failed (np chart) and Percent Failed (p chart). If a new data point exceeds the relevant SPC control limits, a process control alarm will appear which must be cleared.
 |
|